You’ve signed up and you get the general gist of your analytics feature - but are you actually making the most out of just how MUCH you can track? If it wasn’t totally awesome, it would be creepy. That‘s how much you can see.
I know we at Showcase bang on a lot about how bloody wonderful and amazing our Analytics are. They’re a huge advantage of using Showcase - you know this, and I definitely know this.
Showcase Workshop provides analytic tracking of the entire workshop, as well as individual showcases and users. Analytics is only visible to Admin users, sorry viewers!
Analytics is the default page when you go to the ‘Reporting’ tab of the website.
You can specify a time period at the top right of the page - the default is one month to the current date.
Dust off the spyglass, bring your fake tree disguise and let’s investigate the cool things we can do with Analytics.
Track your top sharers:
This feature is particularly handy if you have many roaming salespeople that work on their own, and don’t have regular check-ins with you. By looking at the Top Sharing Users it shows you the ranking of who is sending the most sharing emails, files or slides and it calculated in a tally.
You can export this data in a handy CSV file too if you want to make your own report.
Have a peep at user Analytics by Showcase:
In addition to specific user analytics, it’s also possible to see the analytics for one particular user’s interaction with a specific showcase.
This can be accessed in two ways: via the showcase-specific analytics, by clicking on a user from the Top Users list OR via the user-specific analytics, by clicking on a showcase from the Top Showcases list.
The user analytics by showcase will show you the top slides and top files viewed by that user in that showcase within the specified time period.
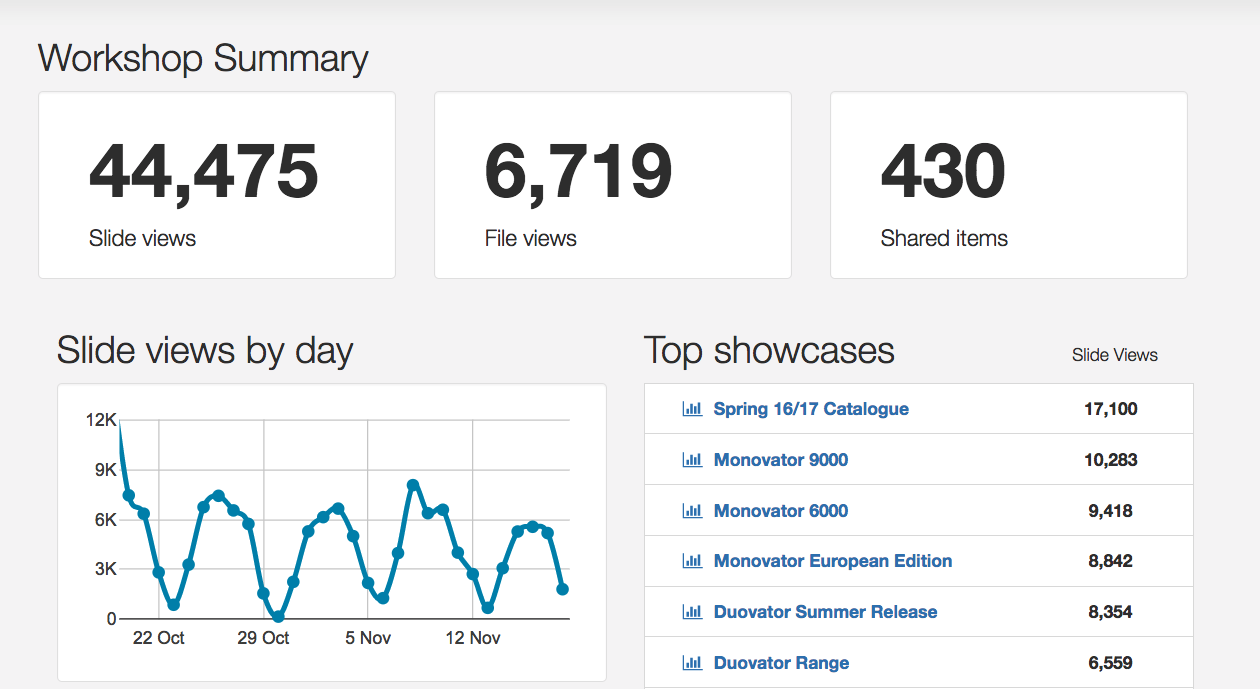
When you're viewing the whole workshop, the information displayed for the specified time period includes:
- a summary of all the slide views, file views, and shared items across all showcases in the workshop
- a graph-based snapshot of how many slide views are occurring per day
- top showcases by slide views within this time period
- top users, i.e. those with the most slide views
most commonly used devices
To jump straight into the analytics for one showcase, you can access them from the “More” drop-down in your options bar underneath the title of your showcase when in Editor mode or in the thumbnail view on the web app.
Analytics by User
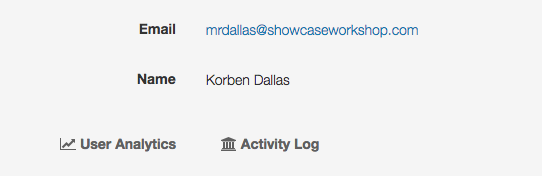
To have a look at the analytics for a specific user by clicking their name from the ‘Top users’ area of the Workshop Summary in Analytics, or by clicking their name from the list in the ‘Users’ tab and then clicking the ‘User Analytics’ link.
When you're viewing analytics for a user, the information displayed for the specified time period includes:
- a summary of how many slides and files they have viewed, and how many items they have shared, across all showcases
- a graph-based snapshot of how many slide views are occurring per day
- a list of the showcases they view the most.
There's a lot you can take from this data: whether a user is using their account regularly, whether they are sharing anything at all outside of showcase, or pick out what is the most popular shared item.
Activity Log
Probably one of the most useful features of the Reporting tab is the Activity Log. Unsurprisingly, it's exactly what it sounds like - it's a detailed log of everything that's been happening in your workshop.
This includes a PLETHORA of info options:
- Downloading a showcase
- Editing a showcase
- Deleting a showcase
- Copying a showcase
- Publishing a showcase
- Restoring a previously published version of a showcase
- Sharing of content: Each time a user shares content (customer name, content shared, time and date)
- Accessing shared content: Each time a customer accesses shared content you have emailed to them (customer name and email, time and date)
- Adding or removing a user
- Adding or removing a user to/from a group
- Importing or exporting a showcase
- Emails that bounced
- Billing: subscription events
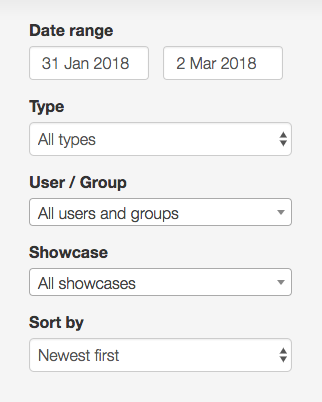
The box on the left contains your filters. If you know exactly what you're looking for, you can sort using these options. leg
The activity log doesn't give you crazy personal detail - you can see that Jane Doe started editing Showcase 1 at 10.15am on the 18th of February, but you cannot see what changes she made specifically.
There you have it - a short and sweet intro to analytics in Showcase. I know you've got an urge to go check on your stats now, so off you go.