Team Showcase has been busy in recent months, rolling out a boatload of new features to make it even easier for you to make, share, and track excellent presentations. Let's take a look at some of the highlights.
Lock Hotspots
Admin and Editor users can attest to the fact that it's often a little too easy to move hotspots when editing a presentation.
And, if you're anything like me, you like your designs to be precise, aligned, and consistent. Once you've carefully measured and lined up your hotspots, the last thing you want is someone else swooping in and moving them around.
The solution? Lock your hotspots!
This new feature is particularly useful if you use layers in your designs, or for hotspots that rarely need to change or move (like logos or other images).
Here's how to lock a hotspot:
- Open your presentation in the Editor
- Find the offending hotspot and click on it
- In the editing toolbar above your presentation, click the little padlock icon at the far left

That's it! Other users won't be able to move or edit that hotspot unless they unlock it (by clicking the same button). When you select the hotspot, you'll see a padlock icon appear above it to show it's locked.

Reporting and Analytics
This one's a visual update and, if you've used our powerful reporting features recently, you've probably already clocked it.
All of our Analytics pages have had a major overhaul and they're looking pretty snazzy if I do say so myself.
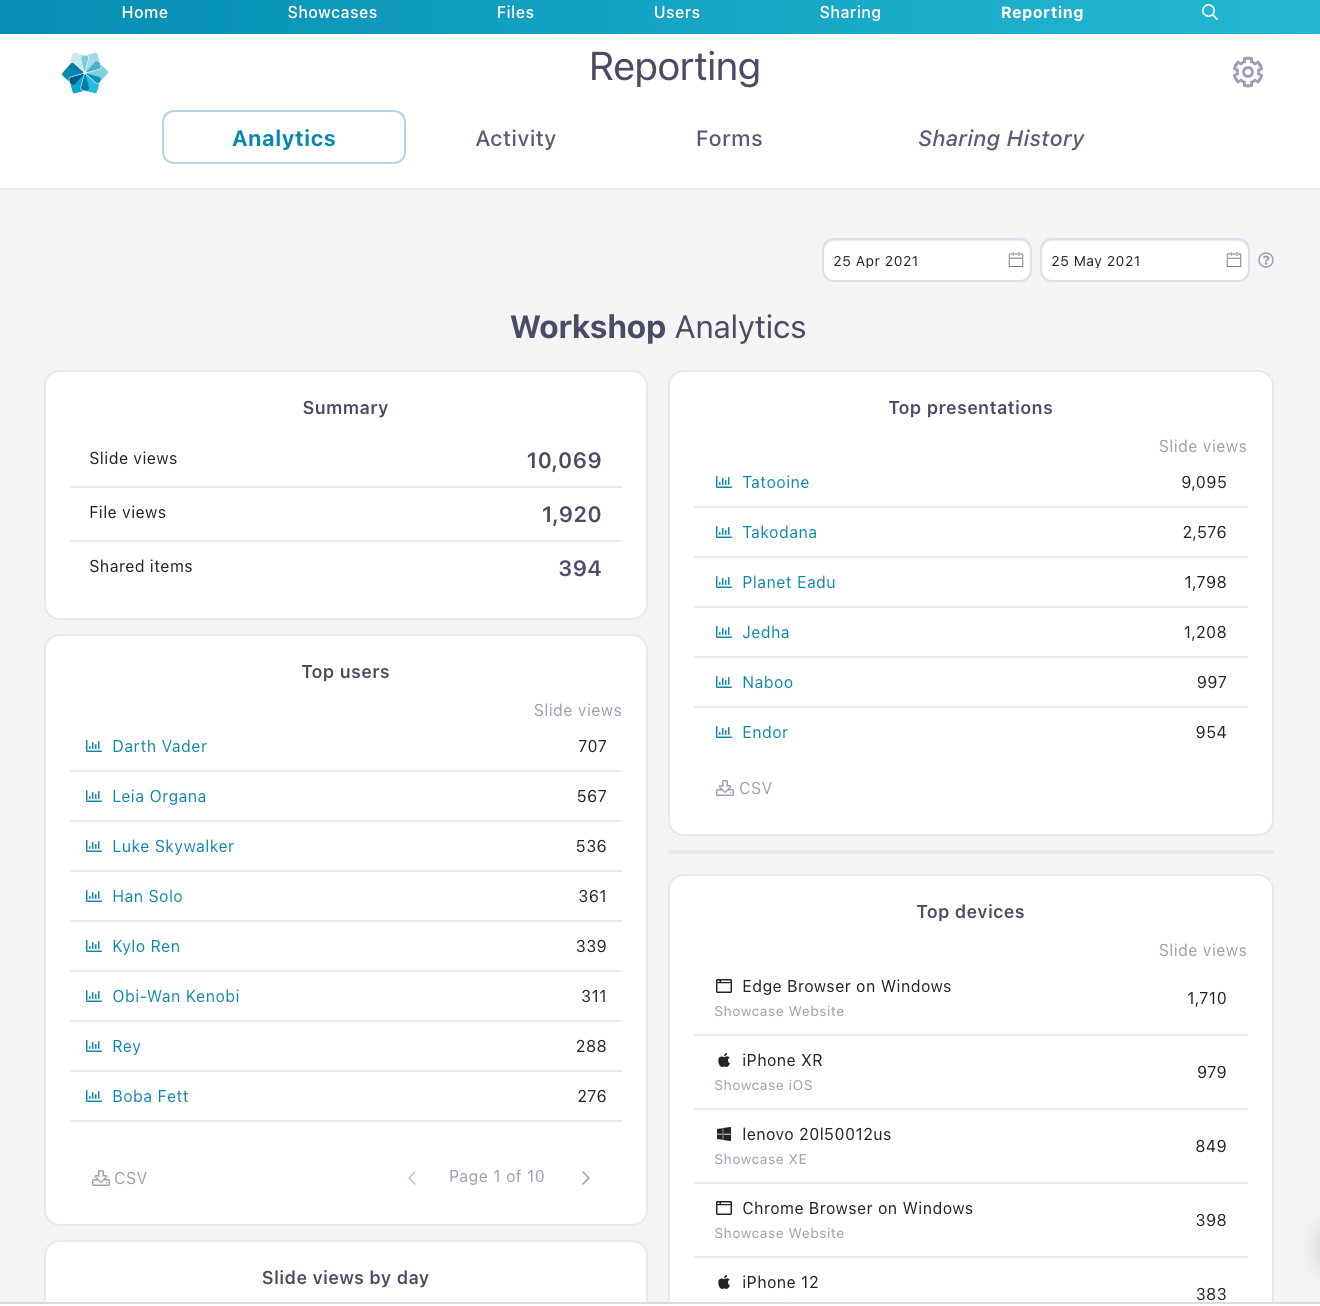
Here's a rundown of the changes:
- The 'Summary' section in the top left is now smaller and sleeker. This makes it easier to see the total number of slide views, file views, and shared items at a glance — without these numbers encroaching on the rest of your analytics.
- We've shuffled the order of the tables based on feedback from users last year.
- The donut graph that used to show the most popular file types has been removed, following feedback from users. This means less clutter on your dashboard and more space for the data that's actually useful to you!
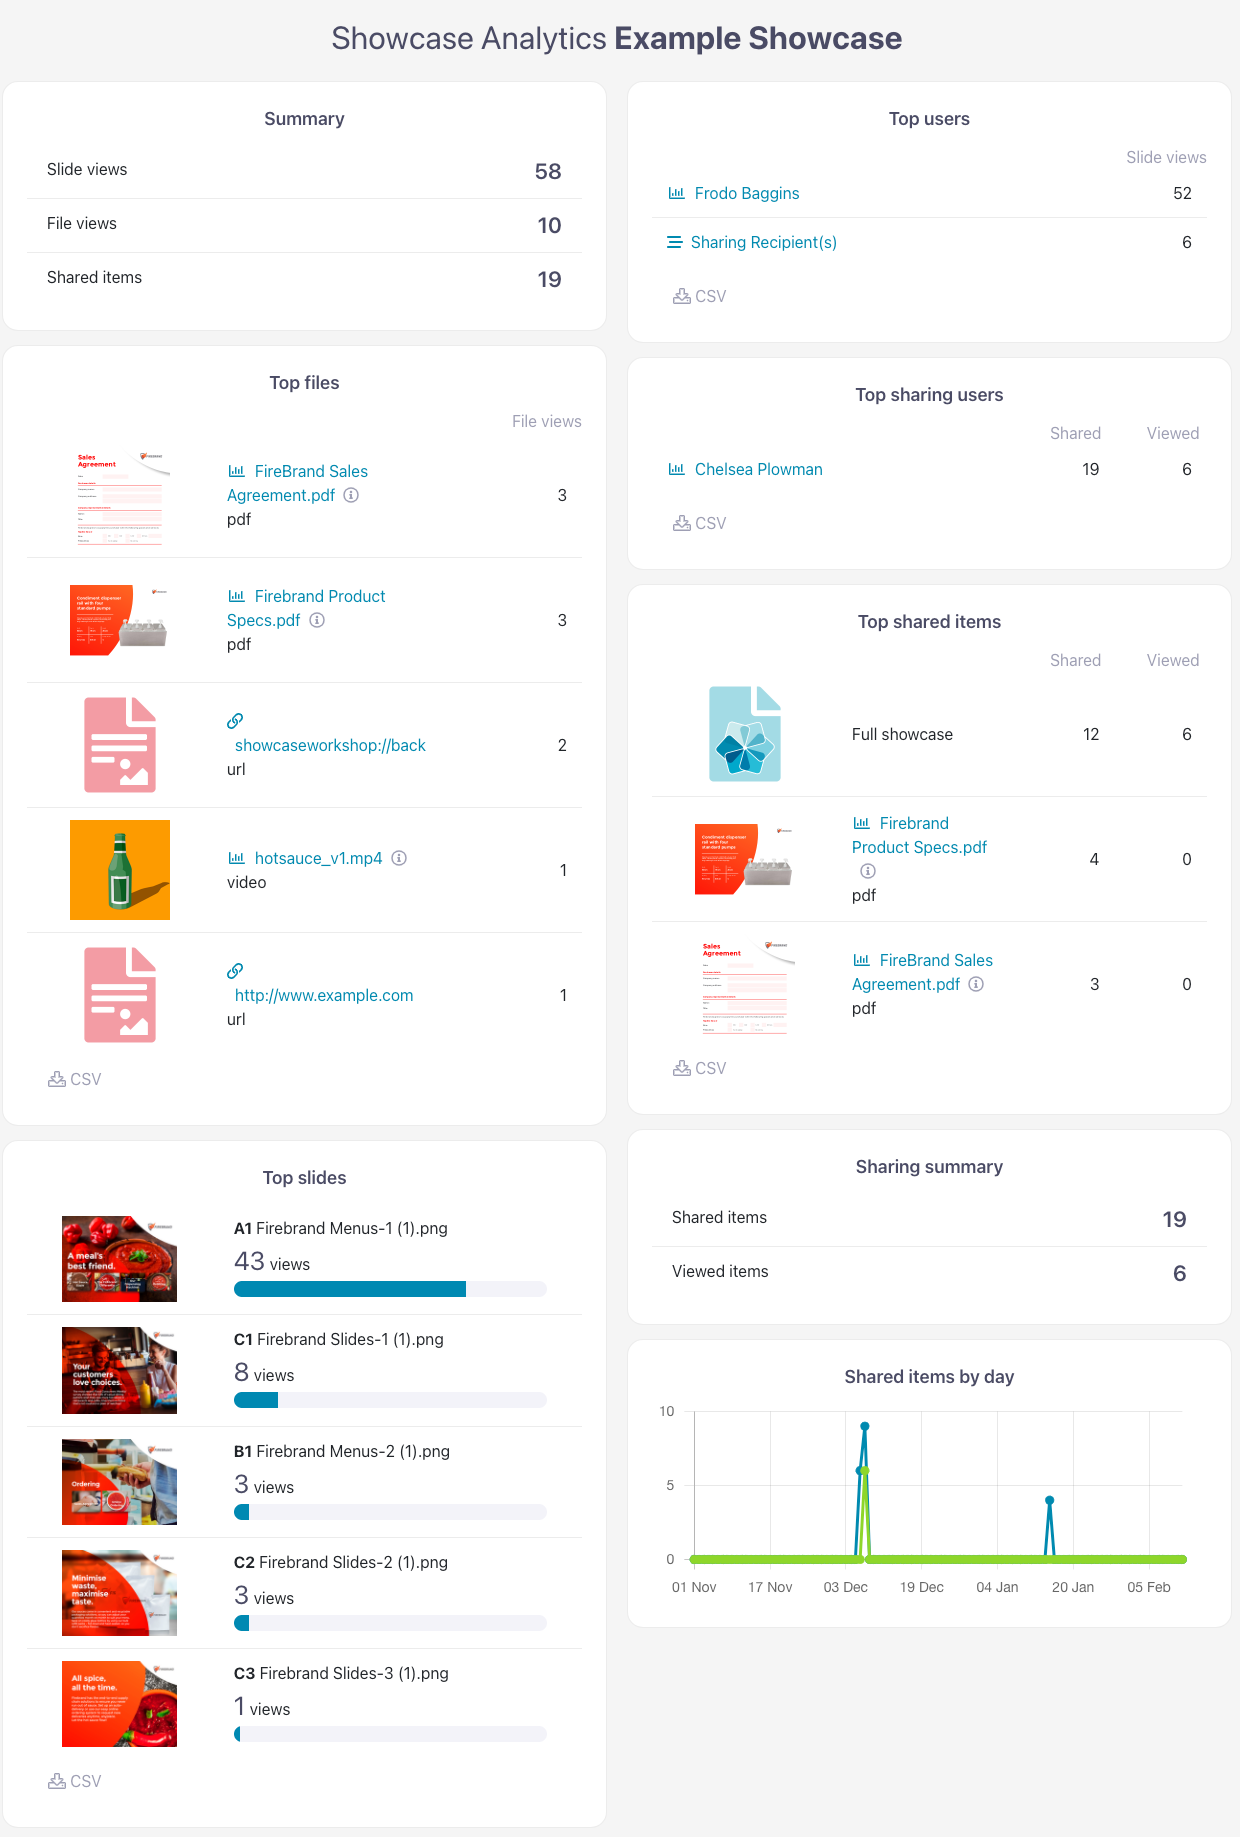
- The graph showing the number of slide views by day is now only available from the Workshop Analytics page. You won't be able to see this graph when looking at analytics by presentation anymore, but you'll still have the graph showing shared items by day on this page.
Overall, these changes make for a simpler, cleaner user experience, focusing only on the data you actually need and use. As always, we're welcoming feedback on these new dashboards. If you think we've missed something or have any other comments on the new look, please let us know!
Slide Navigation
We've also updated the Slides panel in the Editor to make it easier to move around your presentation when you're editing it. The Slides panel sits to the left of your presentation in the Editor and displays a list of all the slides within that presentation.
Here are some of the changes we've made:
- You can now filter the slides that show in this panel to make it easier to find the one you're looking for.
To do this, click the asterix (the star, not the cartoon character) next to the Search bar at the top of the panel. You can then filter by All Slides, Current Slideshow, or Unused Slides.
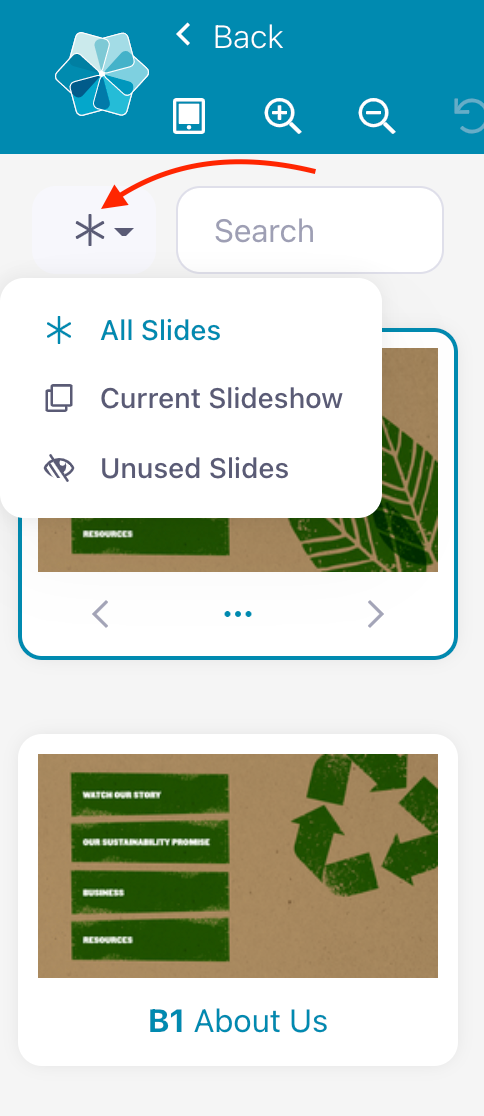
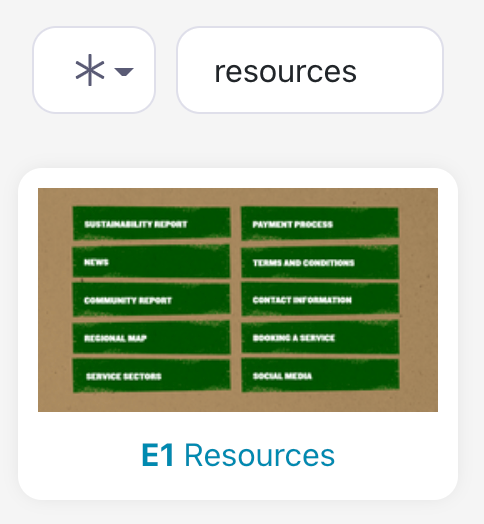
- Speaking of that Search bar, you can use it to search for a specific slide. Search for keywords within the slide name, or use the slide reference number (e.g. E1) if you know it. This will save you time scrolling through your slides looking for a particular one — especially if you've got a lot of slides!
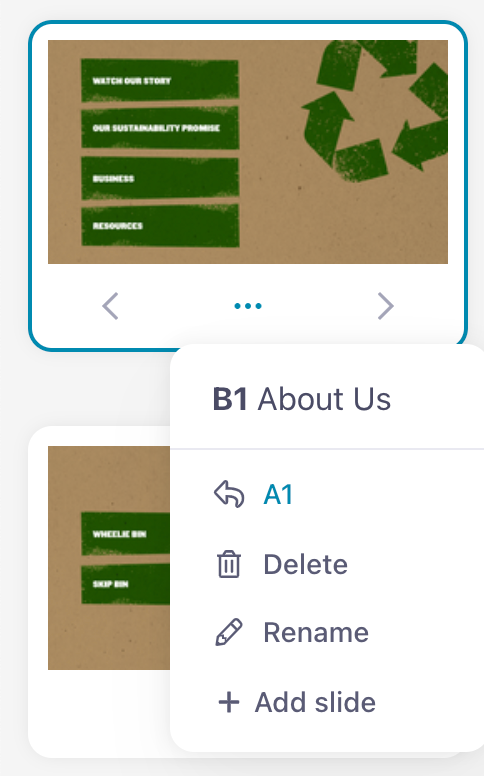
- To view information about a slide now, you'll need to click on it. You'll see three dots appear underneath the thumbnail — the universal sign for a 'More' menu. Sure enough, when you click these dots, you'll see a dropdown menu with the slide name and any hotspots that link to it. You can also use this dropdown menu to delete or rename the slide.
- Using the dropdown menu above, you can also create a swipeable slideshow by clicking 'Add slide'. This will add a slide directly after the one you've selected; these slides will appear in a sequence, so users can swipe through them one after another — like a traditional PowerPoint presentation.
- To rearrange the slides within your slideshow, use the arrows to the left and right of the 'More' menu (those three dots). Users who have been with us for a while will be pleased to know that we've also brought back drag and drop capability for slideshows! Simply click and drag the slides into their new position to move them around quickly.
Again, this is where the 'filter by current slideshow' option described above comes in handy for editing only the slides within that slideshow.
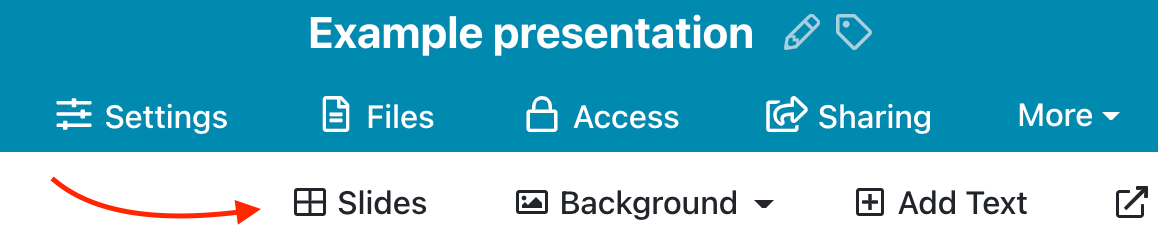
If you prefer to manage your slides from a separate pop-out box, you can do this by clicking 'Slides' in the toolbar above your presentation.
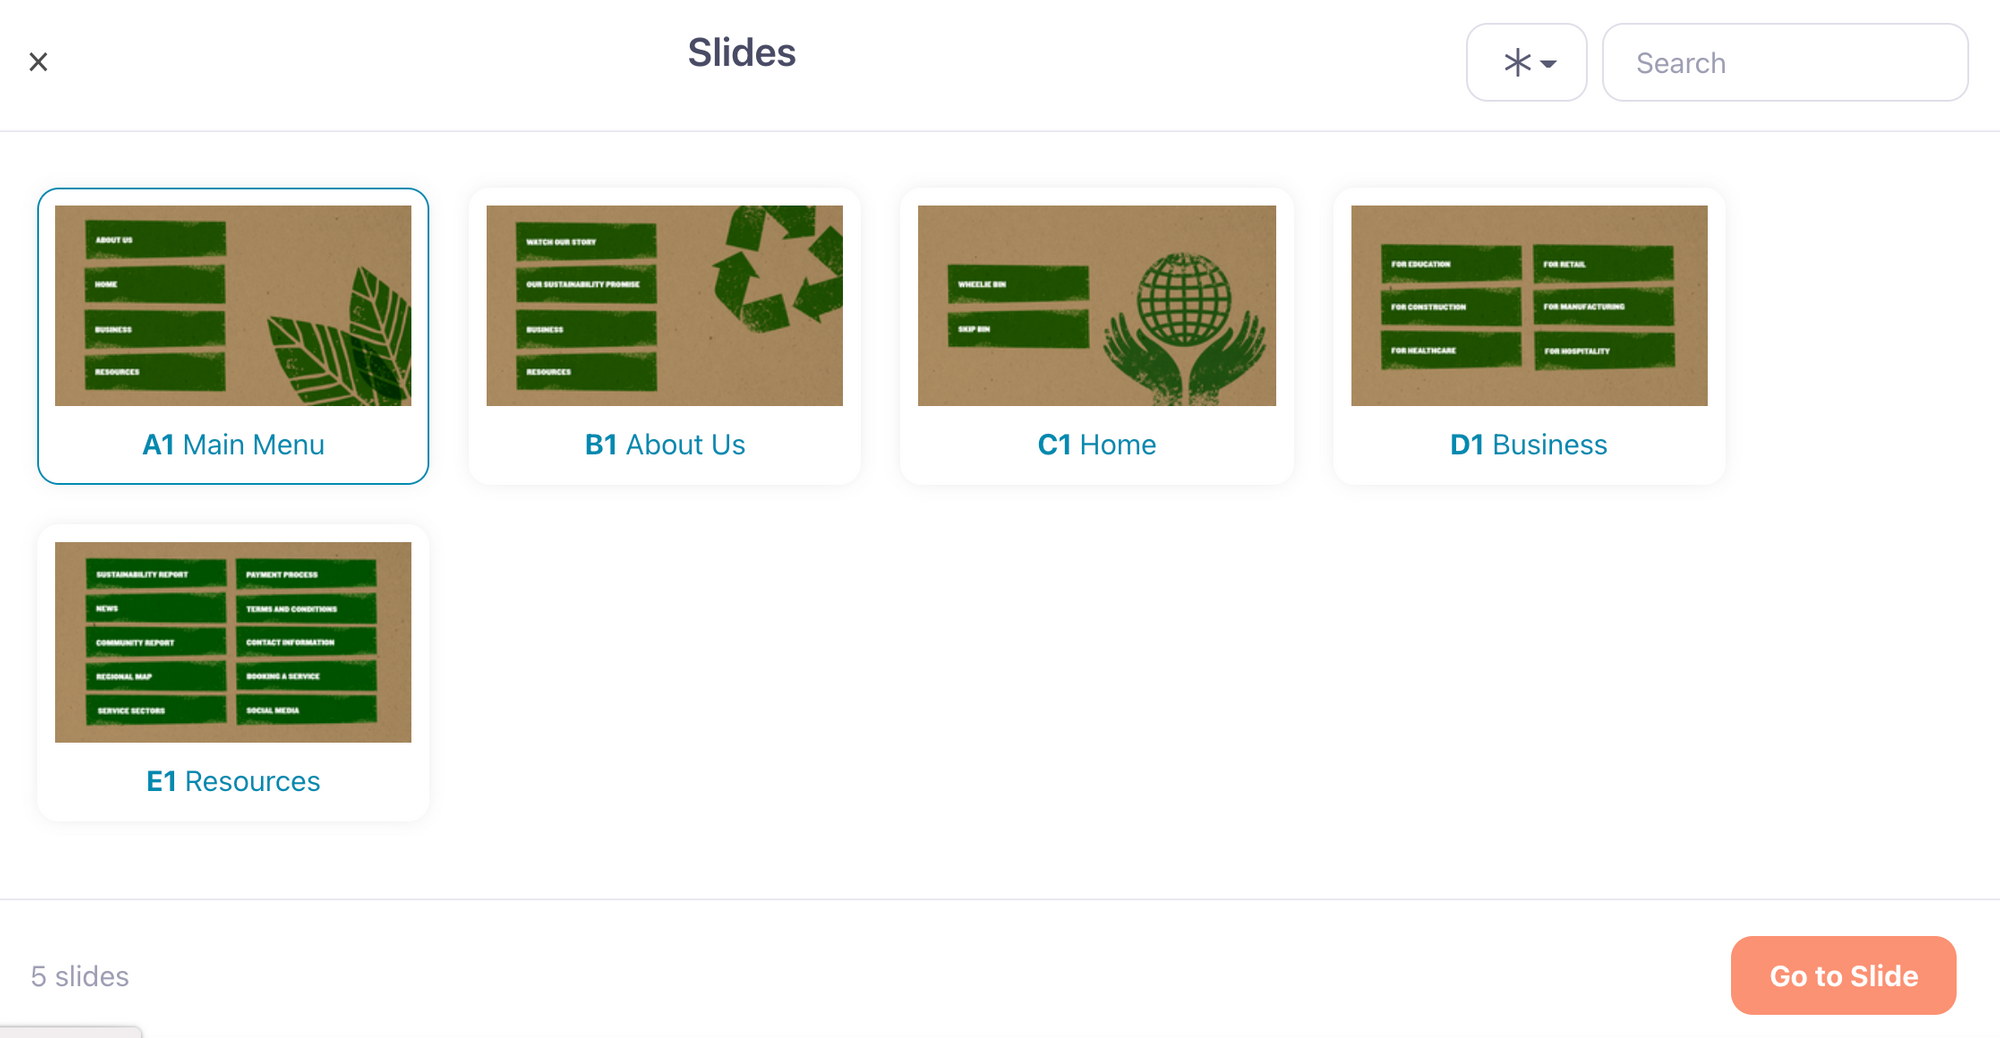
This will open a dialog box where you can view all your slides as a grid. The dialog has all the same functionality as the Slides panel, including the Search bar and filter button in the top right corner.
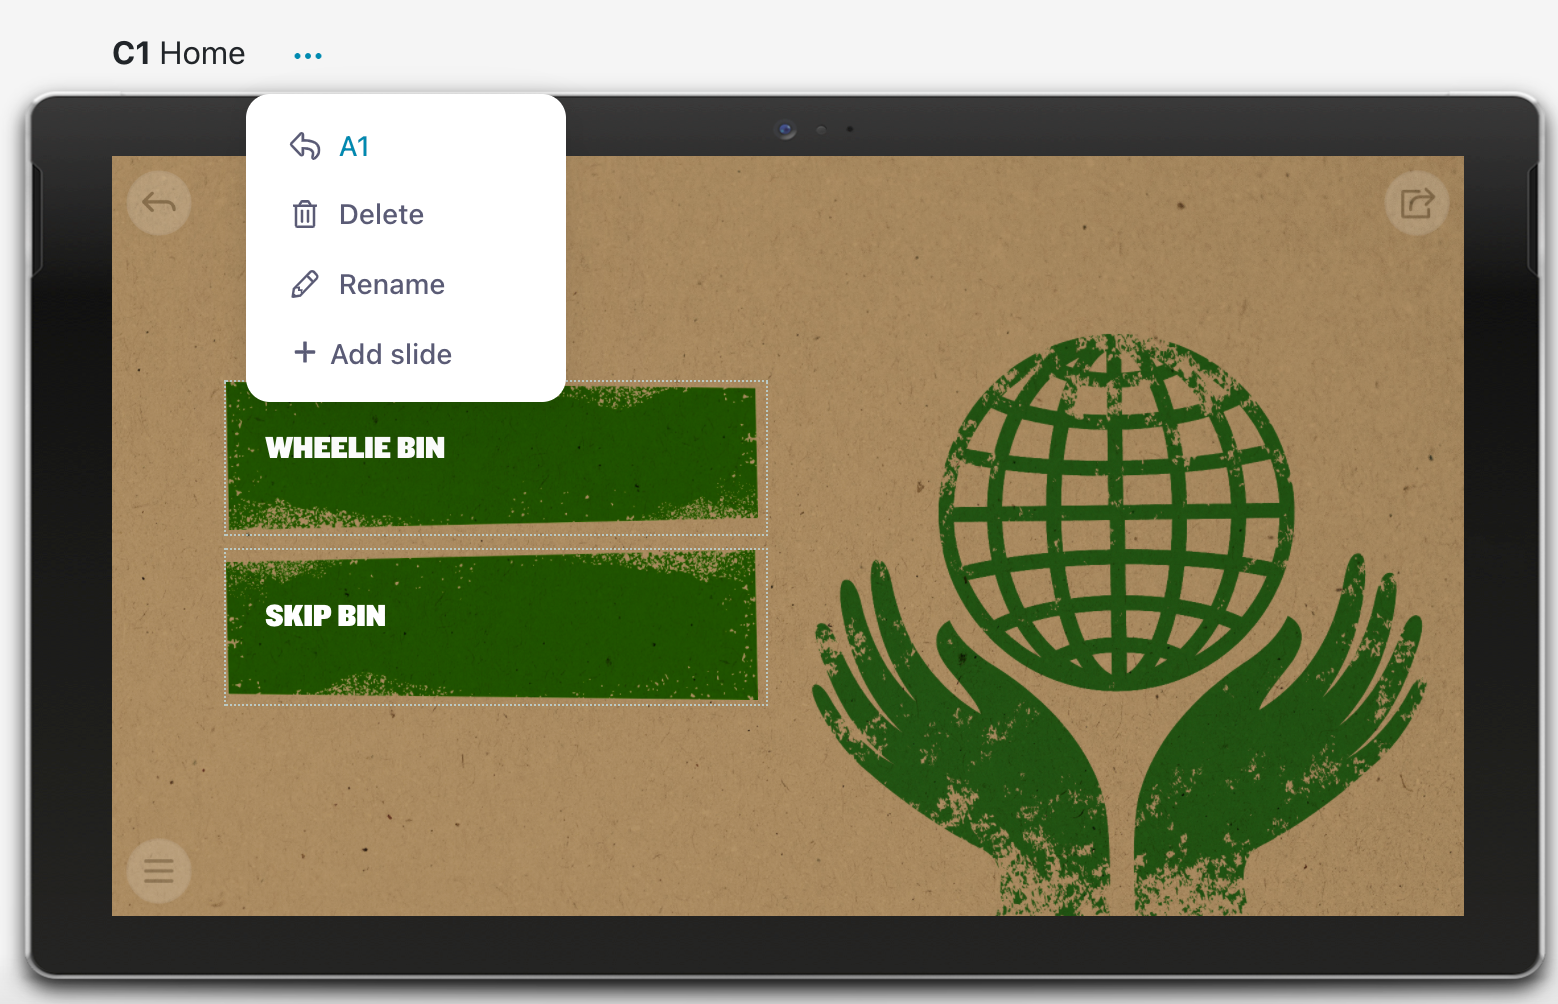
If you want to skip the Slides panel or dialog altogether, you can delete, rename, and add slides using the 'More' menu above the slide preview. Simply click those familiar three dots to open the menu!
Tree Counter
Did you know that a single tree produces an average of 8,500 sheets of paper? That’s 17 reams of standard office copier paper — which is a lot!
Every time you view a slide in a Showcase Workshop presentation, you're saving a sheet of paper because that's one page not printed out. So, for every 8,500 slide views in the Showcase app, you’re saving a whole entire tree. How cool is that?!
Well, it gets better!
For every 8,500 slide views our users make, Showcase donates $10 to Trees that Count. And that $10 buys and plants one native tree.

Now you can check how many trees your organization has saved (and planted) on the web app! Look for the cute wee tree icon in the top right corner, next to the Settings wheel icon. In the screenshot below, for example, you can see that the I Love Trees Workshop has saved 116 trees by using Showcase. That's a lot!

If your organization saves 20 trees in a quarter (that’d be 170,000 page views across your organization), we’ll give you the option to make that donation in your company name.
This is all part of our Forest Releaf Fund work, which you can learn more about on our website.
Well, that's it from Team Showcase for now! A lot of our new features are based on feedback from users, so if you think of something that would make your Showcase experience better please let us know — we'd love to hear from you.