We've made a couple of tweaks to the Reporting function in Showcase, to make it even easier to see file and sharing analytics. You're welcome!
1. File Analytics
The 'Reporting' page is a powerhouse of information about your workshop.
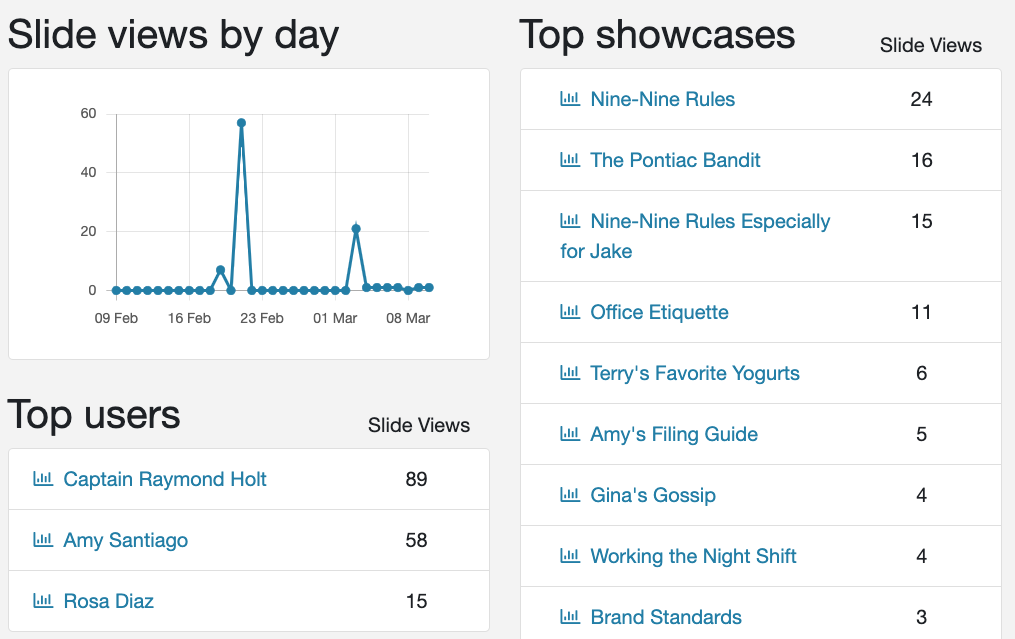
You can view your top users, top showcases, and even your top files within those showcases. But — until now — it was impossible to find data on files that weren't in your top 100.
That's because the 'Reporting' page limits your lists (top users, top showcases, top files) to 100.
While this seems like plenty, if you're from a bigger company with lots of showcases and files it can be hard to find the right data. You might have a file that's getting a lot of views but not quite enough to make it to the top 100, for example.
We don't like to play favorites here at Showcase, so we made a few tweaks and now you can collect data on all your files.
Top 100 Files
You can view files in your top 100 straight from the reporting page. To do this, click on the name of the showcase under the column 'Top Showcases'.
This will open a whole new page where you can view your top slides, a sharing summary (more on that below), and top files.

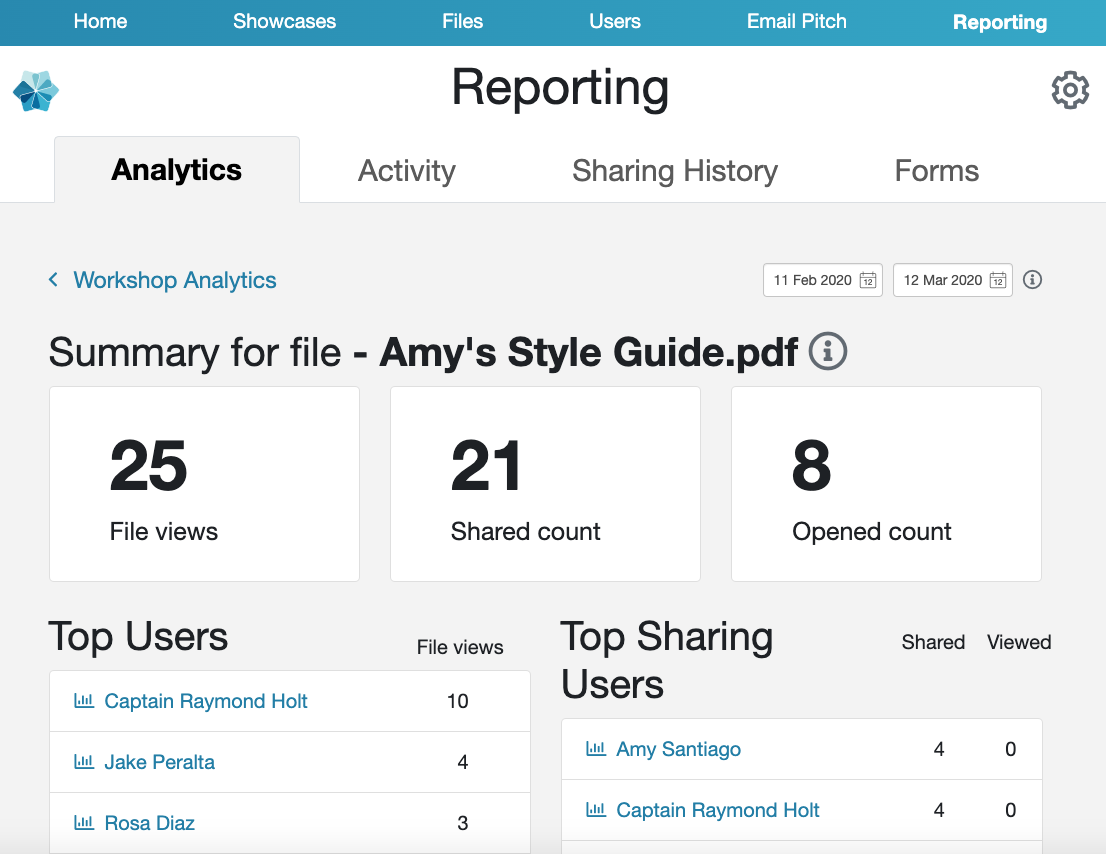
Click through on a particular file to see a summary of its top viewers and sharing history.
'Not-Quite-But-Almost' Files
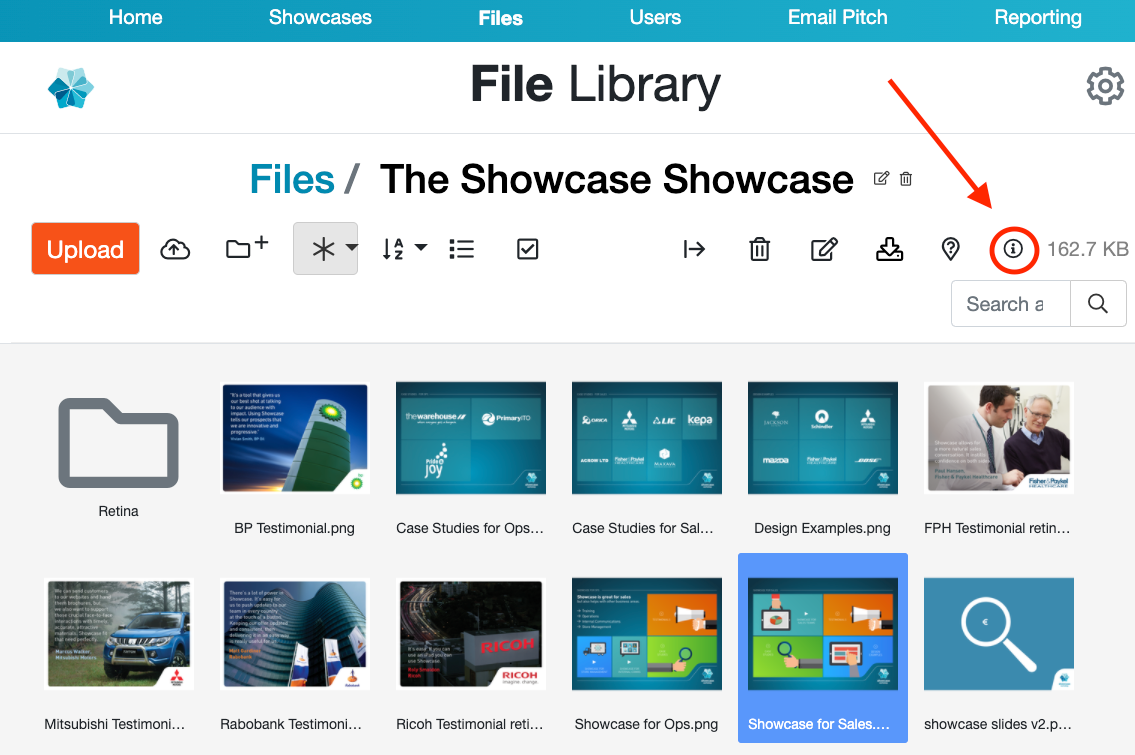
If the file you want is not in your top 100, you can find it by clicking the 'Files' tab at the top of the page. This will open your file library.
Select the file you want to analyze and click the 'information' icon in the top right corner.
You should see the following box pop up. Click the squiggly analytics button (that's the technical term, if you didn't know) to open the reporting page for this particular file.
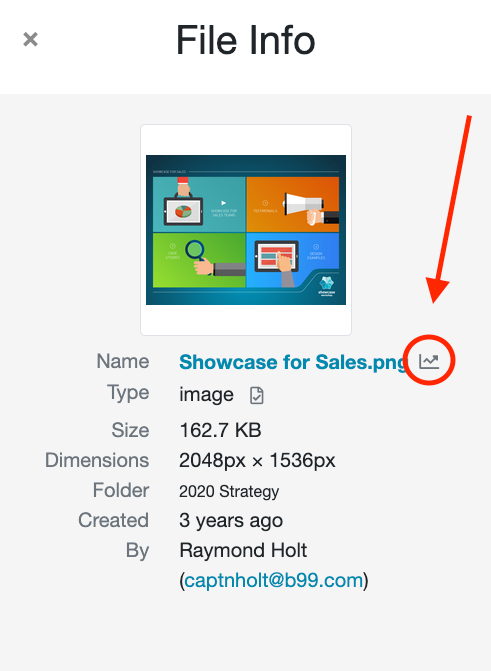
You'll be able to see all the same data that you can for your top 100 files, including file views and shared count. If you have a lot of files, this is really going to help you drill down to see what's working and what isn't.
2. Sharing Summary
But wait, there's more! We've also updated the sharing data available on the 'Reporting' page.
Previously, navigating to a specific showcase's report would give you information about how many times your employees have shared your showcase — but not whether your customers actually opened it.
Now, you can see both counts side-by-side.
To find this report, open the 'Reporting' page and select a showcase to analyze.
Scroll down to the bottom of the page and you should see your 'Sharing Summary' and 'Top Sharing Users' in the left column.
On the right, you can see stats for your 'Top Shared Items'.
Important caveat: At least one of your users will need to have shared at least one thing within your selected time range for any data to show up here. If nobody has shared anything, this column will appear empty.
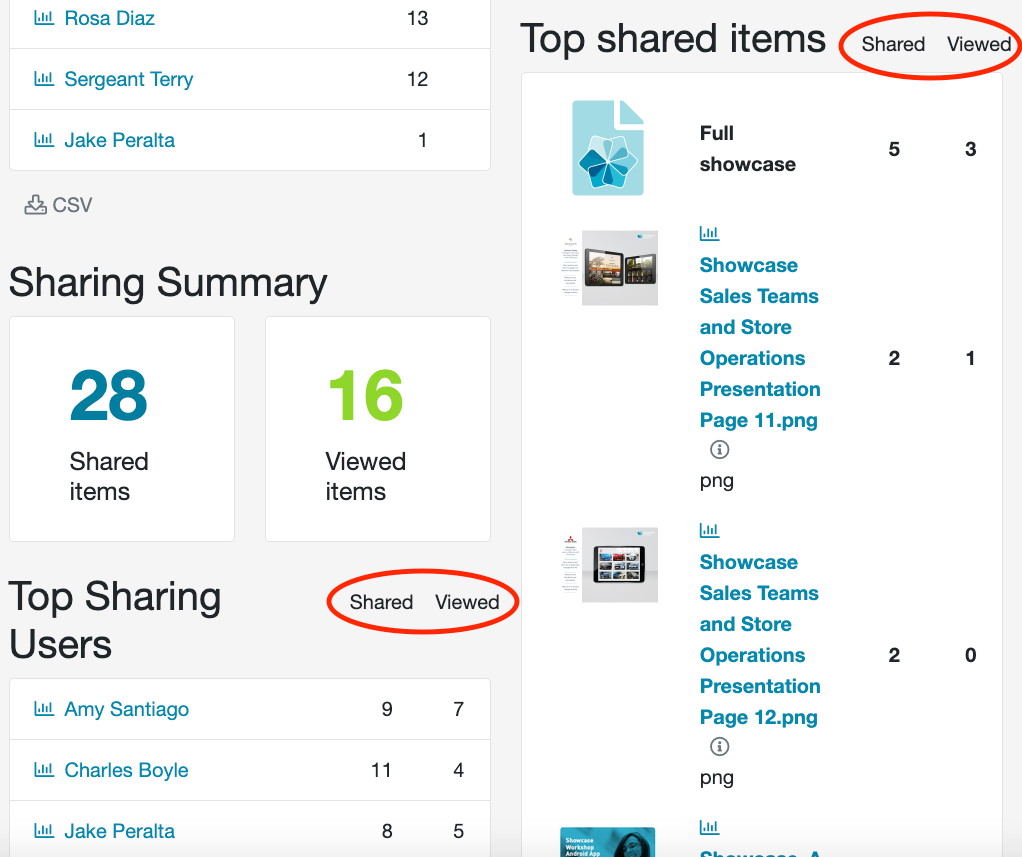
As you can see, each user and item now has a 'shared' and a 'viewed' column. This correlates to — you guessed it — how many times that particular showcase or file has been shared and how many of those customers actually viewed the showcase or downloaded the file.
This is a great way to see whether your pitches are translating into actual interest and sales. You can also track users' performance, in terms of generating interest, by comparing the shared and viewed columns.
It may look great if someone has shared a showcase dozens of times. But if only four people view what they've shared, that's not going to correlate to sales. On the flip side, somebody who shares only a handful of times but has a high viewing rate may actually be bringing you more sales.
A Bonus Tip for Reporting
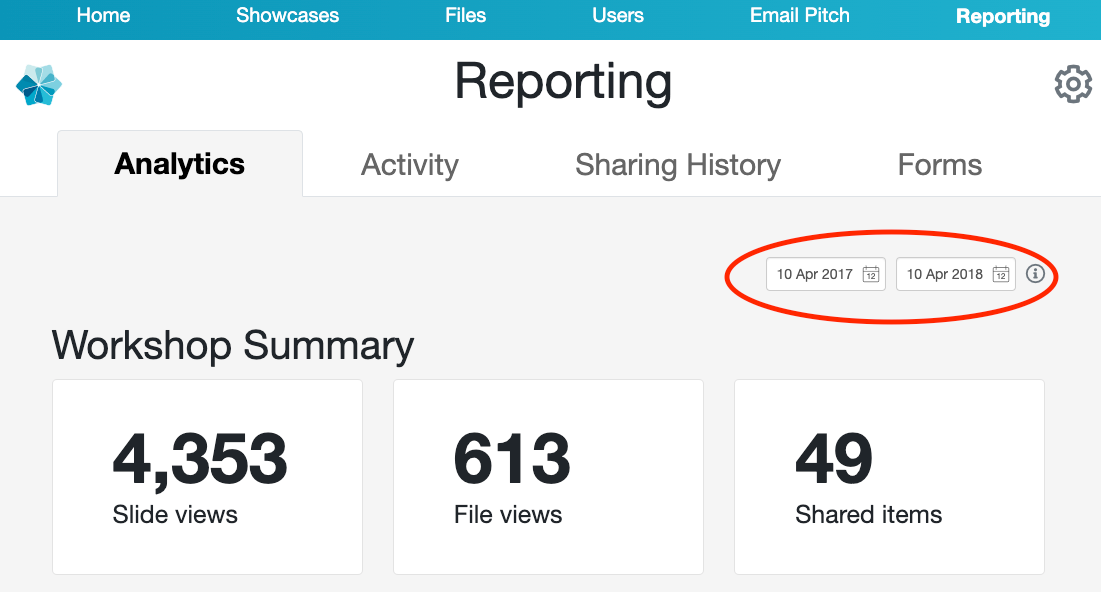
Many users forget that you can filter results by date in the top right corner. Remember: you can go back as far as three years, but can only view a max of one year at a time.
For example, if you were to go all the way back to 10 April 2017 (can you even remember what the world was like back then?) you'd only be able to get data up to 10 April 2018.
If you have any questions about our new analytics feature, send an email to helpdesk@showcaseworkshop.com and we’ll be happy to help you out!